Surface Performance Patterns: Identifying Prop Value in Grand Slam Tennis Events
Logan Schmitz · Jun 30, 2026
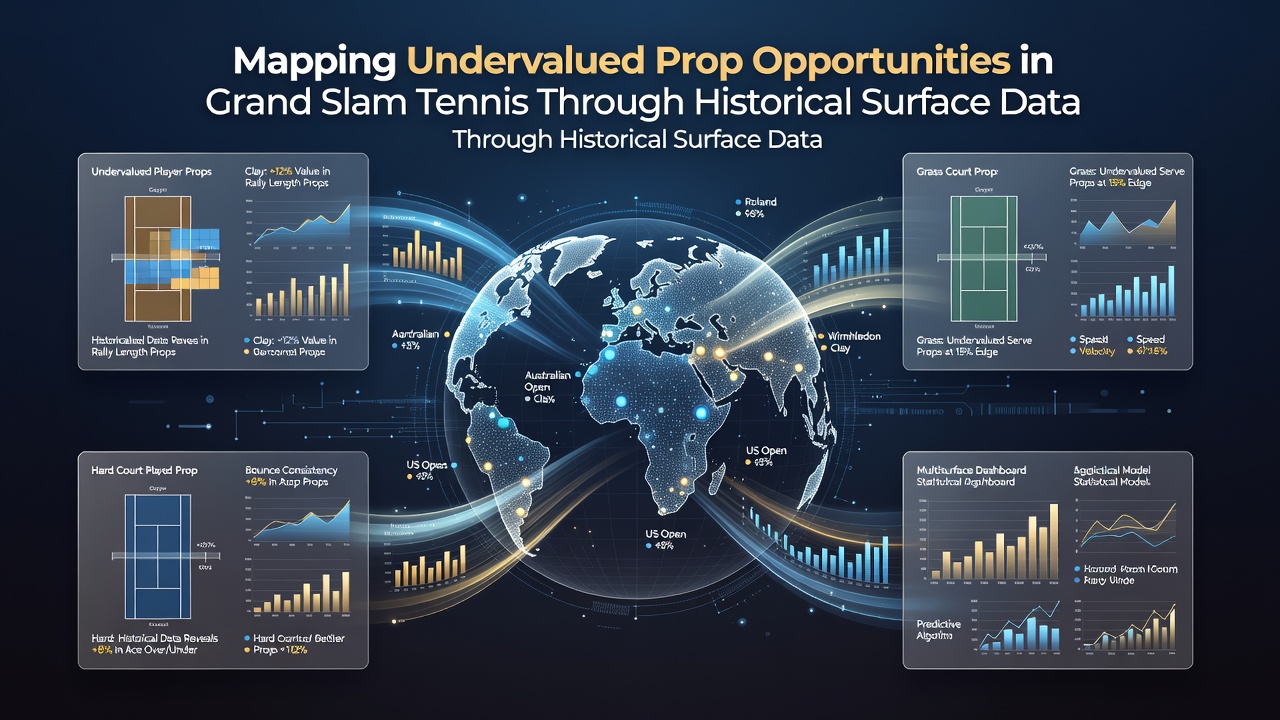
Surface Performance Patterns: Identifying Prop Value in Grand Slam Tennis Events
Grand Slam events rotate through four distinct surfaces each year, and historical records compiled by tournament organizers reveal consistent patterns in player statistics that tie directly to those playing conditions. Clay courts at the French Open slow ball speed and increase rally length, while grass at Wimbledon rewards shorter points and stronger serving; hard courts at the Australian Open and US Open fall in between yet differ in speed and bounce consistency from venue to venue. Researchers tracking match data across decades have documented how these differences translate into measurable shifts in aces, break-point conversion, and total games played per match.
Compiling Surface-Specific Historical Records
Analysts gather point-by-point logs from official scoreboards and video archives maintained by each Grand Slam, then categorize results by surface type and by individual player. Data sets spanning twenty or more years show, for instance, that average ace percentages on grass rise 18 to 25 percent above those recorded on clay for the same cohort of competitors. Similar comparisons track total games completed in completed matches, with grass events finishing in fewer games on average because service breaks occur less frequently.
These records also capture variations within hard-court events. Australian Open courts have historically produced slightly higher rally counts than US Open courts during comparable rounds, a distinction attributed to differences in court preparation and ball selection. Observers note that such granular distinctions become visible only after aggregating multiple editions rather than single tournaments.
Common Prop Categories Influenced by Surface Data
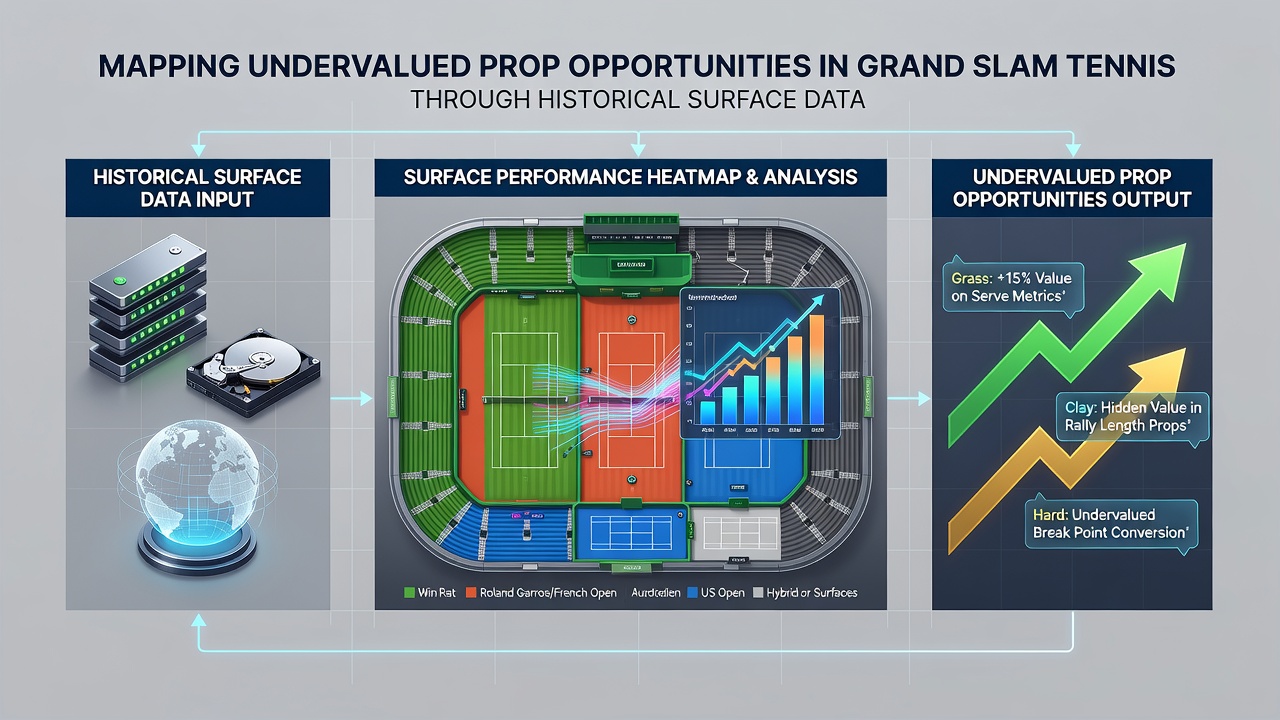
Betting markets frequently offer player props on aces, double faults, total games, and games won by the match winner. Historical surface data supplies baselines for each category. On clay, break-point conversion rates for top-ranked players have averaged above 42 percent across French Open matches since 2005, whereas the same group converts at roughly 34 percent on Wimbledon grass. Prop lines that remain anchored to overall career averages rather than surface-adjusted figures can therefore diverge from observed outcomes.
Additional props track combined aces by both players or total games exceeding a set threshold. Records indicate that grass-court matches between elite servers have exceeded 38 total games in 61 percent of completed encounters since 2010, while equivalent clay-court matches surpass the same total in only 39 percent of cases. Those who compile the figures adjust for round of competition because early-round matches on any surface tend to finish faster than later rounds.
Applying Data to Recent and Upcoming Events
By June 2026 the tennis calendar will have completed the clay-court major and moved into preparatory grass-court events ahead of Wimbledon. Updated historical files now incorporate 2025 results, allowing fresh comparisons between current form and long-term surface baselines. Analysts cross-reference these files with entry lists to flag matches where a player's recent hard-court numbers deviate from established grass-court norms.
One recurring observation involves players whose ace rates climb sharply once they reach grass after a clay-court block. Data from the ATP Tour shows that competitors ranked inside the top 20 have posted a median increase of 2.8 aces per match when shifting from clay to grass within the same season. Prop markets that do not fully adjust for this seasonal transition can leave measurable gaps between posted lines and realized averages.
External Data Sources and Cross-Checks
Independent verification draws on records published by the International Tennis Federation and statistical summaries released through the United States Tennis Association's annual performance reports. Both organizations maintain public archives that list surface-specific metrics without reference to wagering markets. Cross-checking Grand Slam archives against these broader collections confirms that venue-specific effects persist across multiple years and ranking cohorts.
Limitations and Ongoing Refinements
Historical data sets remain subject to changes in equipment and court maintenance standards. Ball manufacturers have altered felt composition several times since 2000, and some tournaments have adjusted court speeds within the hard-court category. Analysts therefore apply weighting factors to older matches when constructing current baselines. Weather records for outdoor venues also enter the models because temperature and humidity influence ball flight and player movement in documented ways.
Despite these adjustments, surface remains the dominant variable separating performance distributions. Continued accumulation of point-level data from each new edition of the four majors allows the models to incorporate recent rule tweaks and scheduling shifts without discarding the longer historical record.
Conclusion
Mapping prop opportunities in Grand Slam tennis therefore rests on systematic comparison of surface-specific historical distributions rather than single-tournament snapshots. When prop lines are evaluated against these distributions, certain statistical categories show repeated divergence on particular surfaces. Ongoing collection of match data through 2026 and beyond will continue to refine the baselines used for such evaluations.