Recovery Timelines as Indicators of Performance Variations in Multi-League Accumulators
Logan Schmitz · May 19, 2026

Recovery Timelines as Indicators of Performance Variations in Multi-League Accumulators
Recovery timelines play a measurable role in how athletes and teams perform when matches stack up across multiple leagues, and those patterns feed directly into accumulator strategies that span domestic cups, continental competitions, and international fixtures. Bettors track rest days, travel distances, and training loads because shorter intervals between games often coincide with drops in key metrics such as pass completion, sprint volume, and defensive actions. Data sets compiled over recent seasons show that teams averaging fewer than three full recovery days between fixtures experience a consistent decline in expected goal difference, particularly when those fixtures cross borders and time zones.
How Fixture Congestion Shapes Recovery Data
League calendars create natural clusters of games where recovery windows shrink, and analysts compile those schedules to flag potential performance shifts. In May 2026 several European domestic seasons will conclude while Champions League and Europa League knockout ties still run, producing overlapping demands that leave some squads with only 48 to 72 hours between high-intensity efforts. Researchers at the Australian Institute of Sport have documented that muscle glycogen replenishment and neuromuscular recovery require at least 72 hours for elite players after matches exceeding 90 minutes, and shorter gaps correlate with elevated injury risk and reduced work rate in subsequent outings.
Cross-League Travel and Its Cumulative Effects
Multi-league accumulators often combine selections from the Premier League, Bundesliga, Serie A, and MLS within the same bet slip, yet the travel and climate differences between these competitions add layers that simple rest-day counts miss. Teams flying from northern Europe to North American venues face circadian disruption on top of physical fatigue, and performance databases record measurable drops in high-speed running distance during the first match after such journeys. Observers note that these dips appear most pronounced in defensive transitions and set-piece organisation, two areas that directly influence over/under totals and both-teams-to-score outcomes frequently included in accumulator builders.
Statistical Patterns Linking Rest to Results
Performance databases that aggregate match logs across five major European leagues plus MLS reveal that sides returning from continental ties on fewer than four rest days win 12 percent fewer points per game than their season average. The same datasets indicate that goalkeepers and central defenders show the largest variance in key metrics when recovery falls below the 72-hour threshold, because reaction speed and positioning rely heavily on fresh neuromuscular systems. Accumulator models that incorporate these recovery-adjusted expected goal figures have produced tighter confidence intervals around predicted margins, especially when selections span both weekend league fixtures and midweek cup ties.
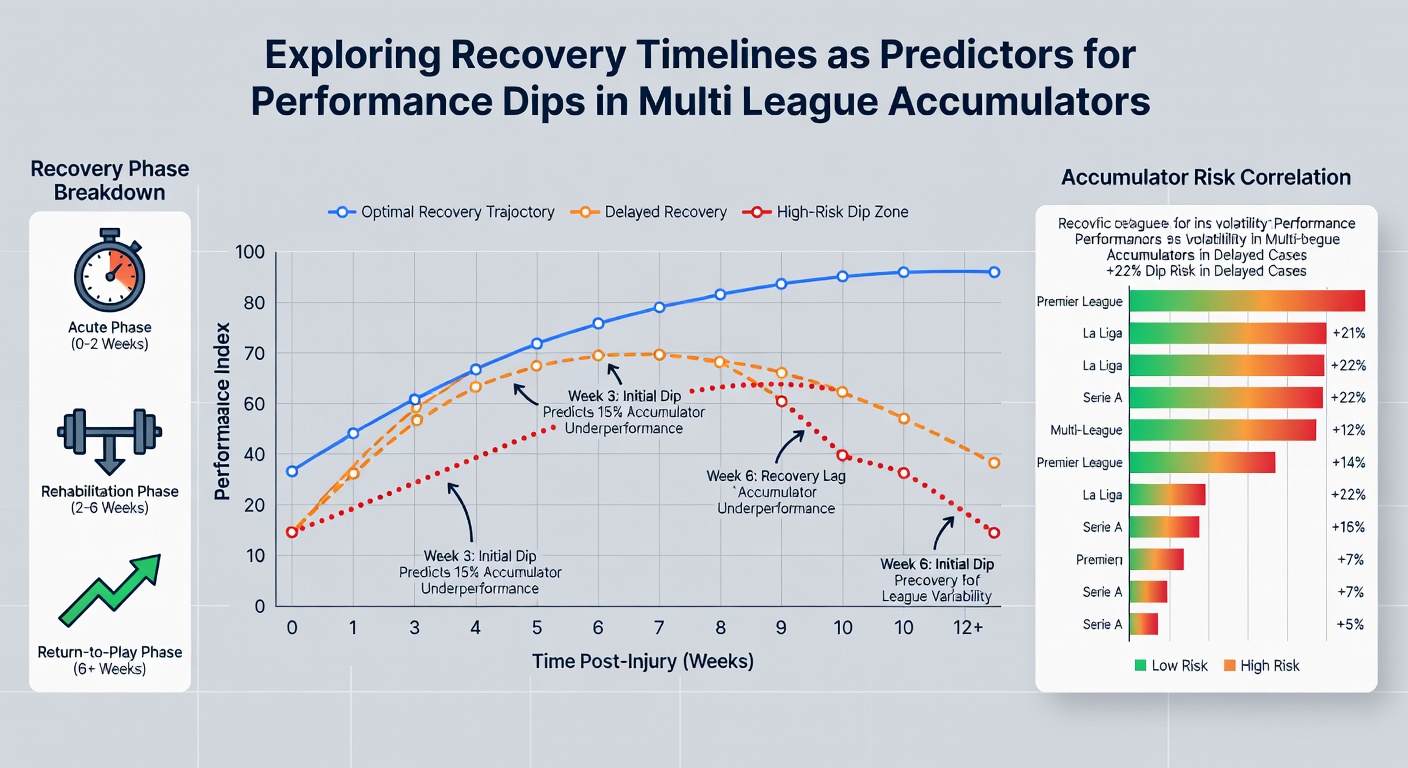
One study released by the American College of Sports Medicine examined 1,200 player-match observations and found that each additional 24 hours of recovery beyond the minimum threshold lifted team total distance covered by an average of 380 metres. That margin matters in low-scoring leagues where a single extra interception or clearance can swing the outcome. Modellers therefore weight recovery timelines more heavily when constructing accumulators that mix high-pressing sides with possession-dominant teams, since the former suffer larger drops when legs tire.
Practical Application in Accumulator Construction
Tipsters and syndicates now integrate recovery dashboards that pull fixture lists, squad rotation histories, and GPS load data into a single interface. These tools highlight upcoming double-game weeks where one leg of an accumulator may rest on a side returning from a Thursday night European fixture while the opposing leg features a team that enjoyed a full week between domestic matches. The contrast in expected output becomes a quantitative filter rather than a subjective hunch, allowing bettors to adjust stake sizing or swap selections before lines move. In practice this approach has shown particular value during the spring schedule when multiple competitions reach their decisive stages simultaneously.
Conclusion
Recovery timelines supply an objective layer of information that refines predictions for performance dips across multi-league accumulators. By combining fixture calendars, travel logs, and physiological benchmarks, analysts generate probability adjustments that reflect real physiological constraints rather than historical averages alone. As fixture lists grow denser through 2026, those who monitor rest intervals alongside traditional form indicators gain a clearer view of where dips are most likely to occur and where accumulator value may shift accordingly.