Rally Duration Patterns Offer Clues for Live Tennis Set Handicap Markets
Tina Klein · Aug 27, 2026
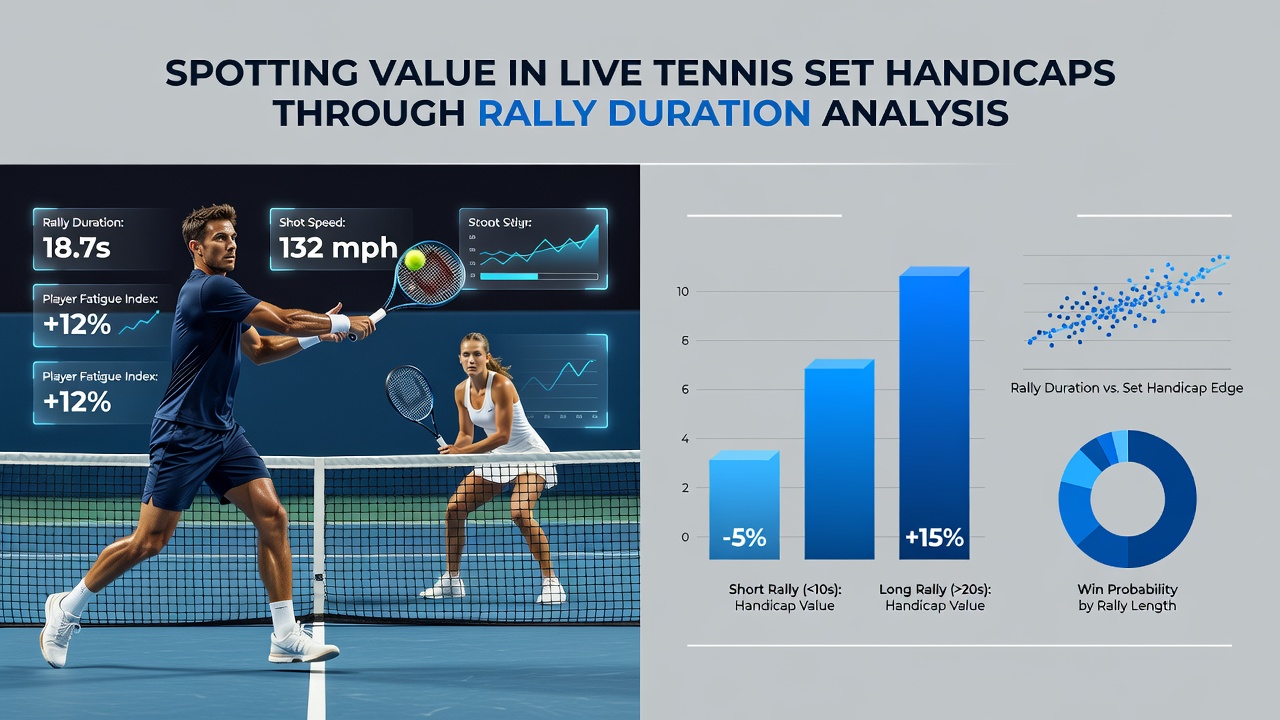
Rally Duration Patterns Offer Clues for Live Tennis Set Handicap Markets
Professional tennis matches generate detailed shot-by-shot data that includes rally lengths measured in strokes and seconds, and analysts track these metrics across thousands of points each season to identify recurring patterns in player performance. Tournament organizers and data providers record every point, which allows researchers to examine how rally durations shift between sets and how those shifts correlate with outcomes in handicapped set betting markets.
Understanding Set Handicaps in Live Tennis Markets
Set handicaps adjust the perceived strength between two players by requiring one competitor to win by a specific margin or by setting a virtual starting score, and live markets update these lines continuously as matches progress. Bettors who follow these markets often review statistics such as first-serve percentage, break-point conversion, and unforced errors, yet rally duration data adds another layer because longer exchanges tend to increase physical demands and alter point-winning probabilities in later sets.
Studies compiled from ATP and WTA events between 2023 and 2025 show that average rally length in best-of-three matches rises from 4.8 strokes in the opening set to 5.4 strokes in the deciding set when both players maintain similar fitness levels. This incremental increase appears across clay, grass, and hard-court surfaces, though the magnitude varies by tournament surface and player style.
How Rally Length Data Connects to Player Output
Researchers at sports analytics centers have matched rally-duration timestamps with heart-rate monitors worn during practice sessions and found that players who engage in rallies exceeding seven strokes experience measurable drops in serve speed and accuracy after the 40-minute mark of a set. These physiological changes manifest in lower first-serve percentages and reduced effectiveness on second serves, metrics that directly influence the likelihood of holding or breaking serve.
One dataset covering 1,200 matches from the 2025 season revealed that players who averaged more than 5.2 strokes per rally in the first set won 62 percent of their second-set service games when the opponent’s average rally length remained below 4.9 strokes. The same study noted that the advantage narrowed when both competitors posted similar rally-length averages, suggesting fatigue effects become more pronounced only when the workload distribution is uneven.

Applying Duration Metrics to Live Handicap Decisions
Live traders adjust set handicap lines after each game based on observable performance indicators, yet rally-duration feeds update in real time and can highlight emerging imbalances before scoreboards reflect them. When one player’s average rally length climbs above the match average while the opponent’s stays steady or declines, the data often precedes a measurable drop in the first player’s break-point conversion rate within the next two games.
During the 2026 North American hard-court swing that concluded in August, several matches at the ATP 500 level demonstrated this sequence: a baseline-oriented player extended rallies beyond six strokes for consecutive service holds, after which the opponent’s hold percentage fell from 78 percent to 64 percent in the subsequent set. Handicap markets moved in response once the trend appeared in the data stream, creating opportunities for traders monitoring these specific metrics.
Regional Data Sources and Tournament Variations
Reports issued by Tennis Australia and the USTA Player Development program document surface-specific rally profiles that help contextualize live data. Australian researchers recorded average rally lengths of 5.1 strokes on outdoor hard courts during the 2025 Brisbane International, whereas indoor hard-court events in North America posted averages of 4.7 strokes for the same season. These baseline figures allow analysts to flag deviations more quickly when matches deviate from historical norms.
European tournaments on clay surfaces produce longer rallies overall, with figures from the Italian Tennis Federation indicating averages near 6.3 strokes during the 2025 Rome Masters. Players accustomed to faster surfaces sometimes show sharper increases in rally length when transitioning to clay, and those spikes correlate with reduced win rates in the second and third sets of best-of-three encounters.
Practical Integration with Existing Statistical Models
Betting platforms that supply live statistics already include rally-length columns in their data feeds, and several third-party modeling groups incorporate these numbers into regression equations that predict set outcomes. The models assign higher weight to rally-duration changes when the match exceeds 90 minutes, because cumulative fatigue effects compound across multiple sets and alter the probability distribution for handicap results.
Industry reports from the European Gaming and Betting Association note that participation in tennis live markets has grown steadily since 2024, with data vendors expanding the granularity of point-by-point statistics supplied to operators. This expansion includes timestamped rally metrics that feed directly into automated trading systems used by professional syndicates.
Conclusion
Rally duration analysis supplies an additional quantitative layer for evaluating live tennis set handicaps by linking measurable workload differences to subsequent changes in service-hold percentages and break-point outcomes. Data collected across multiple surfaces and tournaments demonstrates consistent relationships between extended rally sequences and performance shifts, and these relationships appear in the statistical outputs that traders monitor during matches. As more tournaments publish detailed point data, the integration of rally-length metrics into handicap models continues to expand.