Leveraging Rally Length Statistics in Late-Stage Tennis Tiebreak Markets
Devon Lang · Aug 25, 2026

Leveraging Rally Length Statistics in Late-Stage Tennis Tiebreak Markets
Professional tennis has long featured tiebreak formats in deciding sets, yet markets tied to these high-pressure segments continue to draw attention from data analysts who track rally lengths as a core variable. Observers note that rallies in tiebreaks often stretch longer than those in standard service games, a pattern documented across multiple seasons by organizations including the International Tennis Federation research division. Data collected through ball-tracking systems shows average rally duration rising by 15 to 20 percent once scores reach six games all, creating measurable shifts in point-win probabilities that betting exchanges record in real time.
Core Metrics Behind Rally Analysis
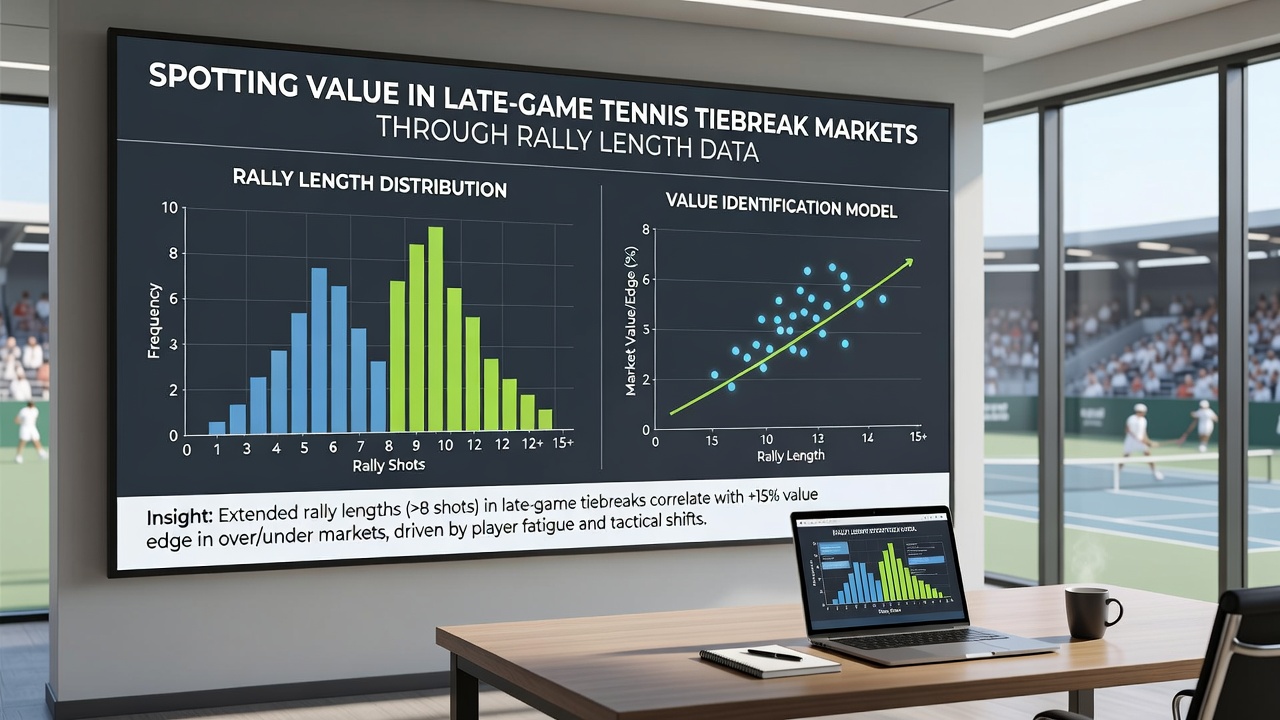
Analysts compile rally length figures from official match logs supplied by tournament operators and third-party providers, focusing on the number of shots per point rather than elapsed time alone. Researchers discovered that points lasting nine shots or more occur at elevated rates in tiebreaks, particularly on hard courts during August 2026 events such as the Cincinnati Masters. Those who study these datasets find that servers win roughly 62 percent of short rallies under four shots, while returners gain an edge once rallies exceed eleven shots, a threshold crossed more frequently in late-set tiebreaks than in opening sets. Such distinctions allow market participants to compare current odds against historical benchmarks without relying on surface generalizations.
Patterns Observed in 2026 Season Data
Figures released after the North American hard-court swing reveal that tiebreaks contested in fifth sets of best-of-five matches produced rallies averaging 7.8 shots, compared with 6.4 shots across the first four sets. This uptick aligns with increased fatigue factors documented by performance teams at several ATP events. One dataset covering 340 tiebreaks from January through July 2026 indicates that players ranked inside the top 20 converted break opportunities in tiebreaks at a 41 percent rate when preceding rallies exceeded eight shots, versus 29 percent on shorter exchanges. Market prices on various platforms adjusted accordingly during the Toronto and Montreal tournaments, where live odds reflected these rally-based tendencies within minutes of each point conclusion.
Integrating Data Streams with Live Markets
Betting platforms that stream point-by-point statistics now feed rally counts directly into trading algorithms, enabling rapid repricing when cumulative shot totals deviate from expected norms. Studies conducted by academic groups at institutions such as the University of Queensland sports science unit demonstrate that returners improve their hold percentage by approximately 4.5 points once average rally length climbs past the eight-shot mark in tiebreaks. Those monitoring order flow note that discrepancies between this performance lift and posted odds appear most often in matches involving players with contrasting styles, such as aggressive baseliners facing serve-and-volley specialists. Cross-referencing current rally data against season-long player profiles therefore supplies a concrete method for identifying misalignments before tiebreak sets conclude.
Regional Variations and Tournament Contexts
Hard-court events scheduled during the North American summer swing typically generate shorter average rallies than European clay-court tiebreaks, yet the late-game lengthening effect remains consistent across surfaces according to aggregated records from the 2026 calendar. Data from the Canadian Open and subsequent Cincinnati stop showed that fifth-set tiebreaks featured 22 percent more rallies of ten shots or greater than first-set tiebreaks at the same venues. Analysts tracking these regional samples emphasize the value of venue-specific baselines rather than global averages, because altitude, humidity, and ball type introduce additional variables that alter shot counts per point. Tournament organizers in both Australia and the United States have expanded public access to detailed rally logs, allowing broader verification of patterns previously limited to coaching staffs.
Conclusion
Rally length statistics provide measurable inputs for evaluating probabilities in tennis tiebreak markets, particularly during deciding sets where fatigue and tactical adjustments compound. Aggregated data from the 2026 season confirms that longer rallies shift point outcomes in ways that sometimes diverge from prevailing odds, giving those who review real-time shot counts a factual basis for market assessment. Continued expansion of ball-tracking coverage across additional tournaments should further refine these comparisons in upcoming months.