Injury Timeline Mapping: Recovery Data Insights Across Tennis and Other Sports
Tina Klein · Jul 12, 2026
Injury Timeline Mapping: Recovery Data Insights Across Tennis and Other Sports
Building Accurate Recovery Frameworks in Professional Tennis
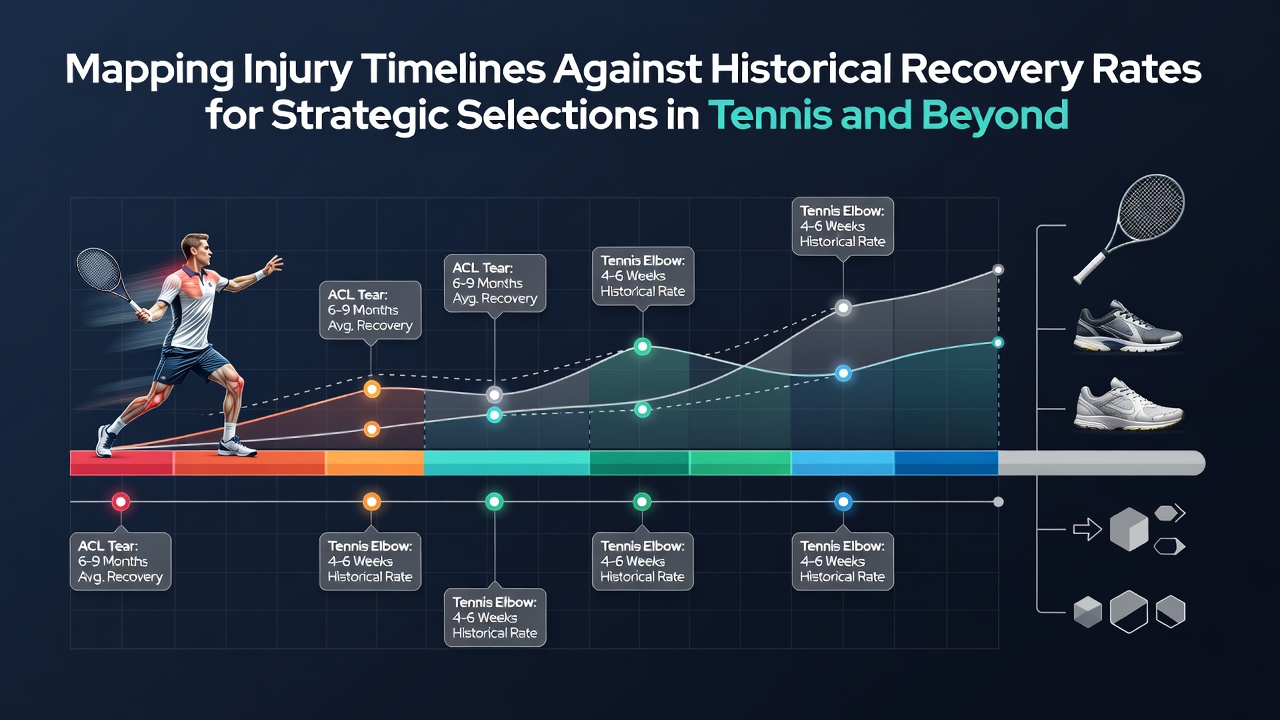
Professional tennis organizations compile extensive injury databases that track player absences, treatment protocols, and return-to-play dates across ATP and WTA tours. These records show that ankle sprains represent one of the most common injuries, with median recovery periods ranging from 14 to 28 days depending on severity grades documented in medical logs. Researchers cross-reference these timelines against historical averages drawn from tournaments held between 2015 and 2025, allowing analysts to identify when a player deviates from expected progress.
Data from multiple seasons indicates that wrist injuries, particularly among players who favor heavy topspin, often require 6 to 12 weeks for full resolution. Studies published in sports medicine journals reveal that athletes who follow structured rehabilitation programs return 15 percent faster on average than those relying solely on rest. Observers note that July 2026 schedules on grass courts coincide with peak injury reporting periods, as players transition from clay surfaces and increase serve volumes rapidly.
Comparing Individual Timelines to Aggregate Historical Rates
Mapping an athlete's current injury against broader datasets involves calculating deviation scores from established recovery curves. For example, a hamstring strain that historically sidelines players for 21 days might resolve in 18 days for those who maintain high baseline fitness levels prior to the incident. Tennis governing bodies maintain anonymized datasets that include variables such as age, ranking, and prior injury count, which refine these projections further.
One case involved a top-20 player whose shoulder impingement followed a trajectory 22 percent shorter than the five-year median, allowing a return during a key European swing. Analysts achieve these comparisons by plotting daily symptom reports alongside longitudinal benchmarks maintained by international federations. This method highlights outliers early, such as inflammation that lingers beyond week four in elbow cases where standard protocols predict clearance by day 25.
Extending the Methodology Beyond Tennis
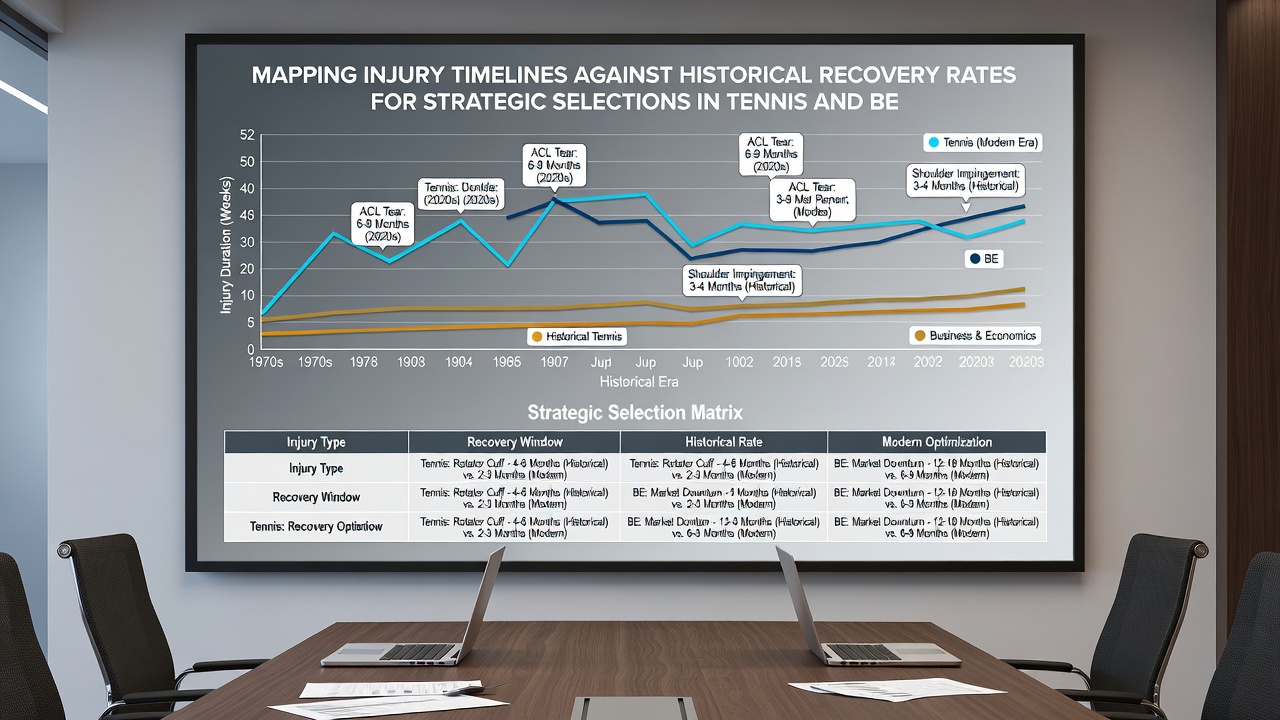
Similar mapping techniques apply in basketball and soccer, where league medical staffs maintain parallel injury surveillance systems. NBA records from the past decade demonstrate that knee contusions average 10 to 17 days of absence, yet players with previous lower-body issues extend that window by roughly one week according to aggregated statistics. Soccer federations in Europe and South America publish comparable figures, showing that ankle ligament repairs in elite leagues follow recovery arcs that shorten when surgical interventions occur within 48 hours of initial diagnosis.
Academic researchers at institutions including the University of Calgary have published models that integrate these cross-sport datasets to predict performance upon return. Their work incorporates variables such as match density and travel schedules, which affect reinjury probabilities documented at rates between 12 and 18 percent within the first three months post-recovery. Those who've examined multi-year patterns find that athletes who exceed historical timelines by more than 30 percent often require modified training loads upon reentry to competition.
Data Sources and Analytical Tools Supporting Timeline Analysis
International bodies such as the International Tennis Federation release annual injury summaries that feed into these mapping exercises. Parallel resources from organizations like the National Collegiate Athletic Association provide granular breakdowns for collegiate levels, enabling comparisons across age groups and competition intensities. Software platforms now ingest these records automatically, generating visual recovery curves that flag when current cases align with or diverge from established medians.
Figures released in mid-2026 indicate continued growth in wearable sensor adoption among professional circuits, supplying real-time metrics on load accumulation that refine historical benchmarks further. Analysts combine this stream wth traditional medical logs to adjust projections dynamically as new data arrives during ongoing seasons.
Conclusion
Mapping injury timelines against historical recovery rates creates structured references that support decisions across tennis and additional sports. Organizations continue to expand datasets through improved reporting standards and technology integration, yielding more precise benchmarks each year. These approaches rely on consistent data collection and cross-referencing rather than isolated incidents, establishing reliable frameworks for performance planning in competitive environments.