Hidden Sync Points: Aligning Player Fatigue Data with Accumulator Construction
Devon Lang · Aug 23, 2026

Hidden Sync Points: Aligning Player Fatigue Data with Accumulator Construction
Player fatigue data has become a central element in modern sports analytics, and researchers continue to examine how these metrics intersect with accumulator construction across multiple leagues. Studies from the Australian Institute of Sport show that endurance indicators, such as heart rate variability and session rating of perceived exertion, often shift in predictable patterns during extended tournament schedules. These shifts create measurable points where performance outcomes align with betting structures that combine selections from different sports or events.
Core Components of Fatigue Tracking
Teams and analysts monitor several variables to build reliable fatigue profiles, including sleep duration, travel distance, and recovery time between matches. Data collected during the 2025-2026 European football season revealed that players logging more than 450 minutes over a 14-day window experienced a measurable drop in high-intensity running output. Observers note that similar patterns appear in tennis, where back-to-back matches on different surfaces compound physical stress. The integration of these data streams with accumulator models allows constructors to identify selections that share common fatigue timelines rather than treating each leg independently.
Mapping Sync Points Across Sports
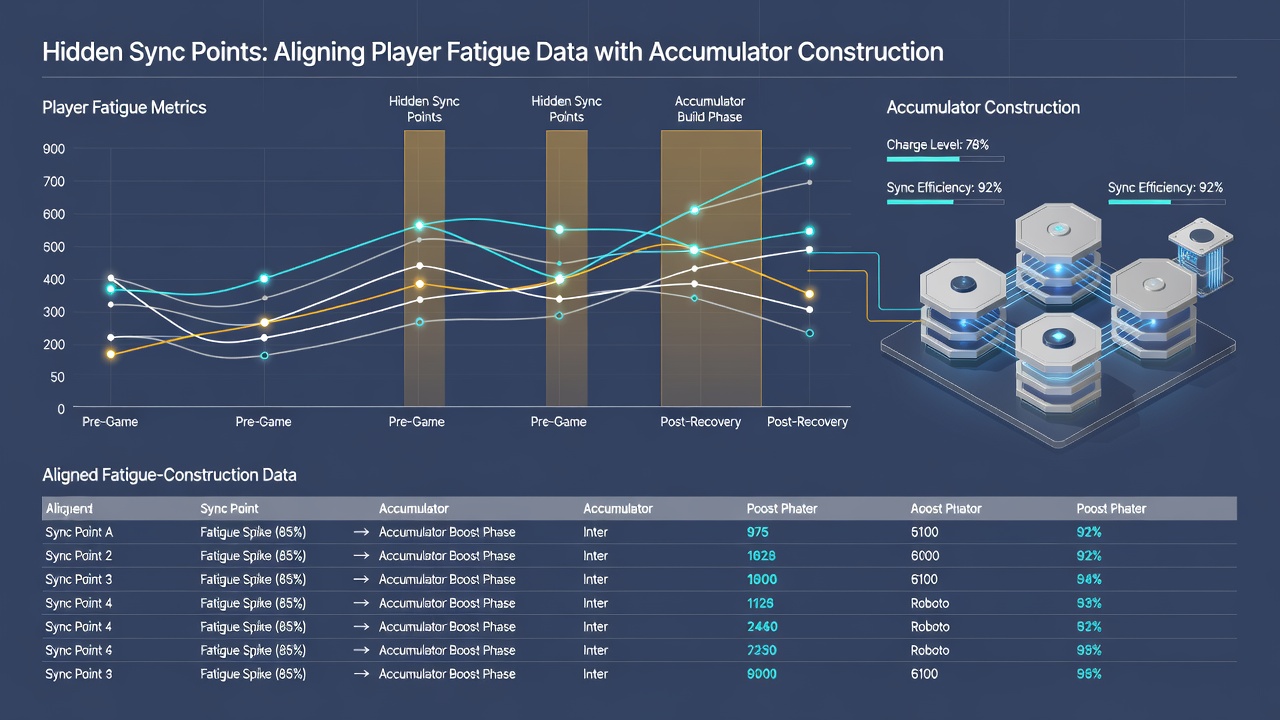
Sync points emerge when fatigue curves from separate competitions overlap in ways that influence joint probability outcomes. One study published in the Journal of Sports Sciences tracked NBA players during the 2026 postseason and found that back-to-back games separated by fewer than 36 hours correlated with reduced three-point shooting efficiency. Those findings parallel data from Australian Rules football, where cumulative load metrics predict elevated injury risk during final series stages. Constructors who align accumulator legs around these overlapping windows can structure bets that account for synchronized performance declines instead of isolated team form.
Building Accumulators Around Fatigue Windows
Effective construction begins with filtering player availability lists through load-management reports released by clubs and leagues. In August 2026, several major football leagues published updated recovery protocols that highlighted midweek fixtures as high-risk periods for key players. Analysts then cross-reference these reports with fixture congestion calendars to select accumulator legs where multiple squads face similar recovery challenges. This approach replaces simple form-based stacking with layered timing that incorporates physiological data directly into the bet architecture.
Practical Data Sources and Integration Methods
Public datasets from organizations such as the Australian Sports Commission provide standardized load metrics that analysts can merge with private tracking systems used by betting syndicates. Additional inputs come from wearable device exports and GPS data shared through academic partnerships. Researchers at Canadian universities have developed open-source algorithms that normalize fatigue scores across different sports, allowing constructors to weight accumulator legs by comparable recovery deficits. The process requires consistent timestamp alignment so that a tennis player's post-match lactate levels can be compared directly with a footballer's training impulse values from the same calendar window.
Case Examples from 2026 Schedules
During the Wimbledon fortnight in 2026, several players competed in both singles and doubles draws while managing residual fatigue from prior grass-court events. Accumulator constructors who flagged these overlaps avoided selections involving those athletes in combined football and tennis bets. Similar patterns surfaced in basketball, where teams playing four games in six days during summer league schedules showed consistent drops in second-half scoring. Data from these periods demonstrates that sync points become more pronounced when travel across time zones compounds existing load, a factor documented in reports from the International Olympic Committee monitoring program.
Limitations and Ongoing Refinement
While fatigue alignment improves accumulator precision in controlled settings, real-world variables such as tactical adjustments and weather conditions still affect outcomes. Analysts continue to refine models by incorporating live in-game metrics that update fatigue estimates during matches rather than relying solely on pre-event data. The August 2026 release of enhanced GPS accuracy standards from several European sports federations is expected to supply higher-resolution inputs for these evolving systems. Observers expect continued collaboration between academic institutions and performance departments to expand the range of measurable sync points across additional disciplines.
Conclusion
Hidden sync points represent a developing intersection between physiological monitoring and accumulator design. Data from multiple sports indicate that aligning fatigue timelines produces measurable shifts in selection outcomes when constructors account for shared recovery windows. Continued access to standardized datasets and improved tracking technology supports further integration of these methods across global betting markets.