Harness Circuit Insights: Pace Figures and Speed Data in Wagering Strategies
Lars Schmitz · Jul 16, 2026
Harness Circuit Insights: Pace Figures and Speed Data in Wagering Strategies
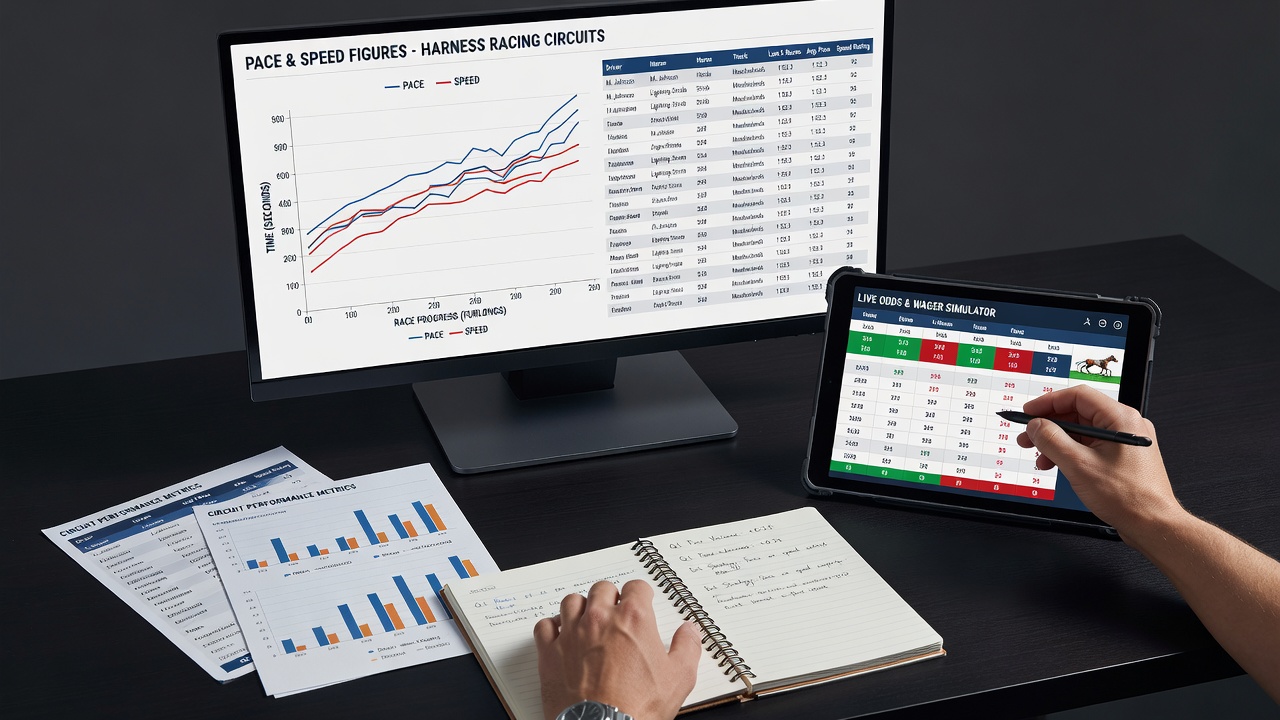
Harness racing relies on consistent gait maintenance and precise timing splits, which makes pace figures and speed data central tools for those analyzing wagers across North American, Australian and European circuits. These measurements capture how horses distribute effort over specific distances while accounting for track conditions, class levels and equipment variations that alter final times.
Understanding Pace Metrics in Trotting and Pacing Events
Pace figures break a race into segments such as the opening quarter, half-mile and three-quarter splits, revealing whether a horse sets the tempo or conserves energy for a late move. On half-mile tracks common in the United States and Canada, early fractions often prove decisive because shorter straights limit passing opportunities, whereas larger mile ovals in parts of Australia allow more room for sustained drives. Observers note that horses posting sub-27-second opening quarters frequently encounter resistance later, while those recording balanced 28-second halves maintain stronger finishes when the final panel stretches beyond 29 seconds.
Speed Ratings and Track Adjustments
Speed ratings convert raw times into comparable numbers by factoring in track variant, surface moisture and wind conditions recorded on race day. Organizations such as Harness Racing Australia publish daily variants that adjust base figures for each meeting, allowing direct comparison between a 1:54.2 mile at a fast Lexington oval and a 1:57.0 effort over a rain-affected Menangle surface. Data compiled through July 2026 shows that circuits applying these standardized adjustments produce ratings with lower variance across meets, which in turn supports more consistent cross-track evaluations for multi-leg wagers.
Applying Figures to Different Circuit Types
One-mile tracks reward horses that control early fractions because they can dictate positioning without excessive energy expenditure, while five-eighths and half-mile venues favor closers who drop behind rapid opening quarters. Researchers examining Ontario and New South Wales data sets found that pacers with speed figures rising at least four points over their prior three starts win at elevated rates when entered against similar class levels on half-mile circuits. Bettors cross-reference these patterns with driver statistics, noting that certain reinsmen excel at timing moves off specific pace scenarios documented in past charts.
Case Examples from Recent Meets
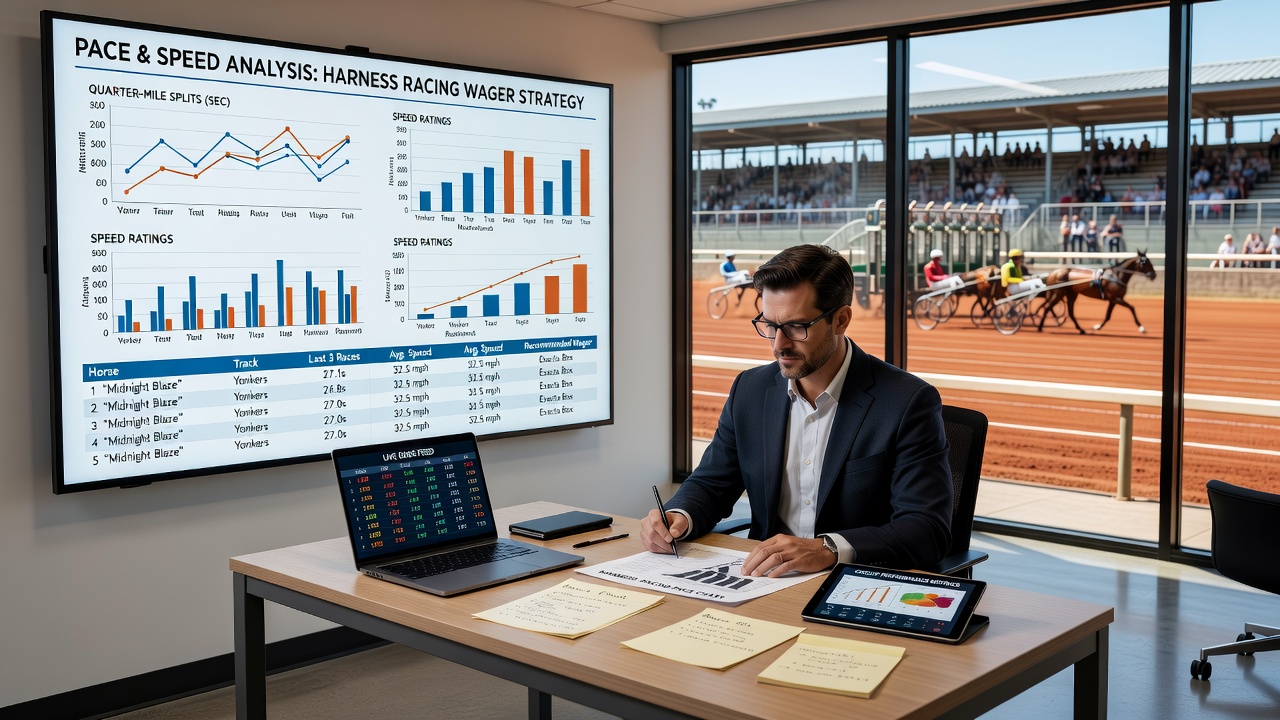
During a June 2026 card at Pocono Downs, a gelding posting a 27.1 first quarter and a 55.4 half-mile split carried a speed figure four points above its rivals yet finished fourth after fading in the stretch; subsequent analysis showed the horse had raced against weaker fractions in prior outings. Conversely, a mare at Albion Park in July 2026 recorded slower early splits but improved its final rating by six points when stepping up in class, resulting in a wire-to-wire victory that aligned with pre-race projections derived from adjusted speed data. These instances illustrate how combining segment times with overall ratings helps isolate horses whose current form matches the expected pace shape of an upcoming event.
Integration with Class and Equipment Records
Class drops or rises alter the baseline against which speed figures are measured, so analysts adjust ratings when horses move between conditioned claiming levels and open company. Equipment changes such as the addition of hopples or modifications to head poles appear in official charts and often coincide with measurable shifts in quarter splits. Reports from the United States Trotting Association indicate that horses switching to lighter sulkies show average improvements of 0.8 seconds in final times on fast tracks, a margin that registers clearly once speed ratings incorporate the change. Those reviewing entries routinely compare these historical adjustments against current pace projections before finalizing selections.
Conclusion
Comprehensive review of pace figures and speed ratings supplies structured information that reflects actual performance trends across varied harness circuits. By examining segment splits alongside track-adjusted ratings and supporting variables such as class movement and equipment, participants obtain a clearer view of how individual horses are likely to distribute effort in upcoming races. Continued compilation of these metrics through established industry sources supports ongoing evaluation of wagering approaches on both domestic and international meets.