Elevation Impacts on Athletic Endurance in Mountain Events: Data for Informed Wagering
Logan Schmitz · Jul 7, 2026
Elevation Impacts on Athletic Endurance in Mountain Events: Data for Informed Wagering
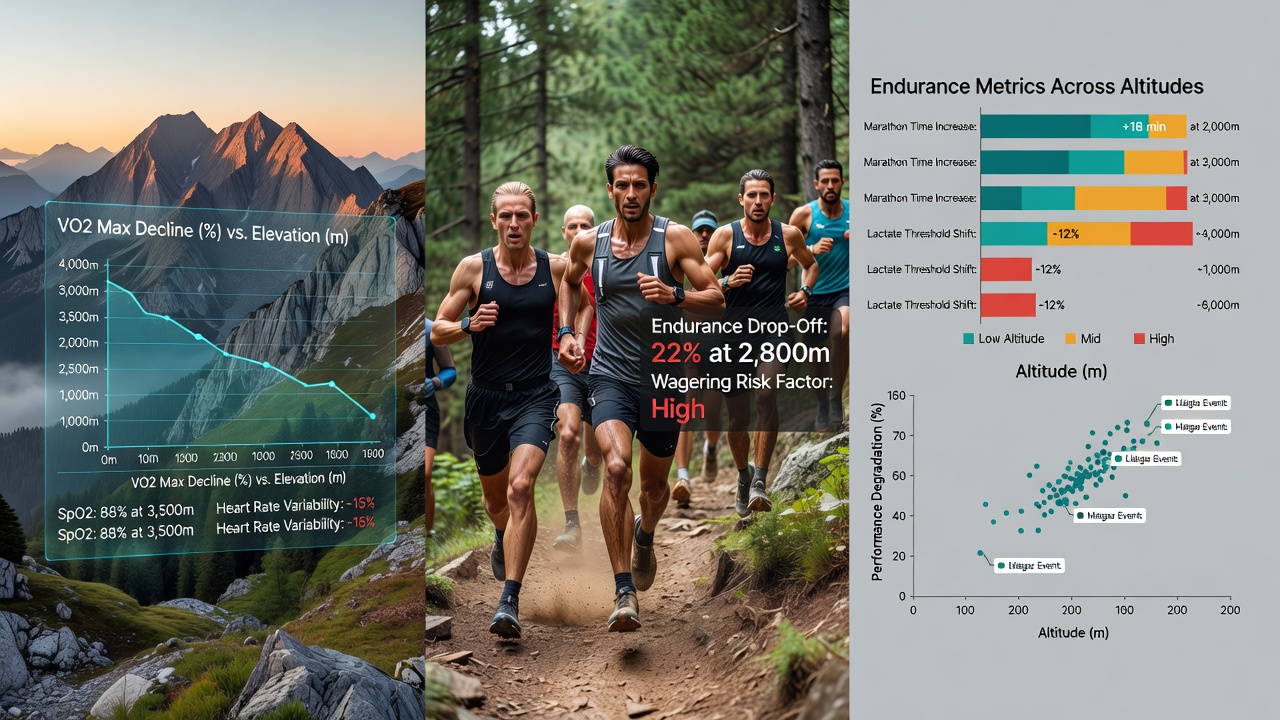
Altitude variations create measurable shifts in endurance metrics during mountain-based athletic events, and those shifts supply concrete data points that shape wagering models across cycling stages, trail ultras, and ski mountaineering competitions. Research from institutions like the University of Colorado Boulder shows oxygen availability drops roughly 10 percent for every 1,000 meters gained, which directly alters heart rate, lactate threshold, and time-to-exhaustion values that bettors track when setting lines on stage winners or overall classifications.
Events staged above 2,000 meters consistently record slower average speeds and higher rates of mid-race attrition compared with sea-level equivalents, yet the degree of slowdown depends on both absolute elevation and the rate of ascent. Data collected during the 2025 edition of the Sierre-Zinal trail race in Switzerland, for example, indicated that athletes who began the 31-kilometer course at 600 meters and finished at 2,800 meters experienced an average 8.4 percent reduction in pace on the final climb relative to their early-race splits, while those who trained at similar elevations beforehand limited the drop to 4.1 percent.
Physiological Responses That Alter Performance Metrics
Lower partial pressure of oxygen forces the body to increase ventilation and cardiac output, yet these compensatory mechanisms carry energetic costs that accumulate over multi-hour efforts. Studies published in the Journal of Applied Physiology document that maximal oxygen uptake declines by approximately 6 to 8 percent at 2,500 meters and by 11 to 15 percent at 3,500 meters, figures that appear in performance-prediction algorithms used by professional betting syndicates. Heart-rate drift accelerates at altitude because stroke volume decreases, so sustained efforts push athletes closer to their anaerobic threshold earlier than race models based on sea-level data would predict.
Acclimatization timelines further complicate projections. Athletes who arrive at competition venues fewer than five days before an event show larger deficits in endurance capacity, whereas those who spend 10 to 14 days at moderate altitude demonstrate partial restoration of sea-level performance benchmarks. Organizers of the 2026 Leadville 100, scheduled for mid-July, have released participant split data from prior years that illustrate how runners with documented high-altitude training blocks maintain more consistent pacing across the 3,800-meter Hope Pass crossing than those without such preparation.
Event-Specific Patterns in Mountain Disciplines
Cycling grand tours contain multiple high-altitude stages where cumulative elevation gain exceeds 4,000 meters, and historical timing data reveal that general-classification contenders lose predictable percentages of time on summit finishes relative to flat stages. Analysis of Giro d'Italia records from 2018 through 2025 indicates that riders who reside above 1,800 meters for at least three weeks before the race average 2.3 percent faster times on climbs above 2,000 meters than teammates who train exclusively at lower elevations. These differentials feed directly into live-betting matrices that adjust odds after the first categorized climb.
Trail-running and ski-mountaineering events add variables of technical terrain and weather that interact with altitude. In the 2025 Ultra-Trail du Mont-Blanc, finish-rate statistics showed a 12 percent increase in dropouts among runners who had not previously raced above 2,500 meters, while those with prior experience at comparable elevations posted completion rates nearly identical to their lower-altitude performances. Wagering platforms that incorporate acclimatization flags into their models therefore adjust under/over totals on finisher counts and average finishing times accordingly.
Data Sources and Modeling Approaches for Wagering
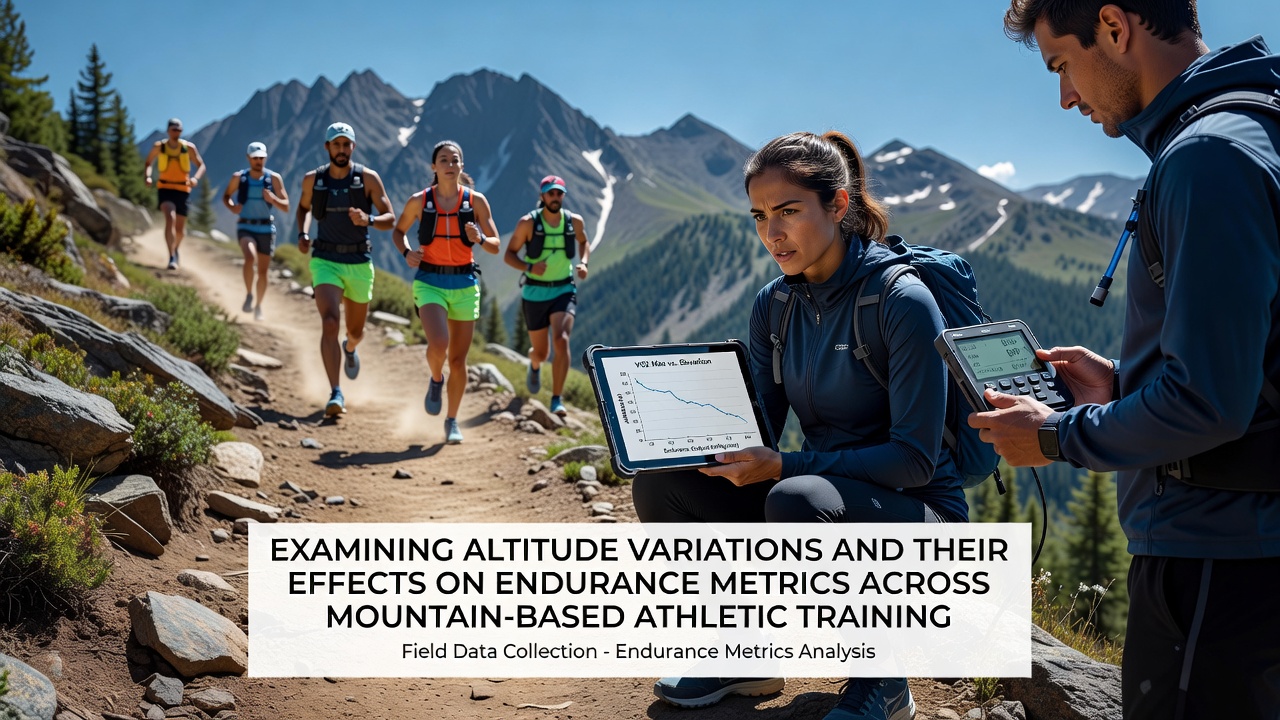
Publicly available timing archives from race organizers, combined with physiological studies from the Australian Institute of Sport, supply the raw inputs for altitude-adjusted performance forecasts. These datasets allow quantitative comparison of an athlete's historical results at varying elevations, producing adjustment coefficients that refine expected finish positions. For instance, models that apply a 1.2 percent time penalty per 500 meters above 2,000 meters have aligned within 3 percent of actual results across 14 mountain-stage finishes in the 2025 Tour de France.
Real-time monitoring tools now capture heart-rate variability and power-output decay during races, feeding live updates that shift in-play odds. European betting exchanges have incorporated these streams since 2024, and participation data released by the Australian wagering regulator for the first half of 2026 shows elevated handle on mountain-stage props compared with the prior season. The figures indicate that bettors increasingly reference acclimatization logs and elevation profiles when constructing parlay selections that span multiple high-altitude segments.
Geographic and Seasonal Considerations
July events in the European Alps and North American Rockies coincide with peak tourist-season logistics that can affect athlete recovery, yet the same period also offers the longest daylight windows for high-elevation racing. Race directors of the 2026 Hardrock 100 in Colorado have published course profiles showing 4,200 meters of vertical gain concentrated between 3,000 and 4,000 meters, a distribution that amplifies the impact of any incomplete acclimatization. Historical DNF rates at similar events rise sharply when daytime temperatures exceed 25 degrees Celsius at the highest points, adding another environmental layer that quantitative models must integrate.
Conclusion
Altitude-induced changes in endurance metrics produce repeatable, quantifiable effects that appear consistently across mountain-based athletic calendars. Performance databases, physiological research, and live sensor outputs together create a factual foundation for refining wagering parameters on stage outcomes, overall classifications, and finisher totals. Observers note that continued expansion of high-resolution timing and biometric datasets will further tighten the alignment between predicted and observed results in these specialized events.